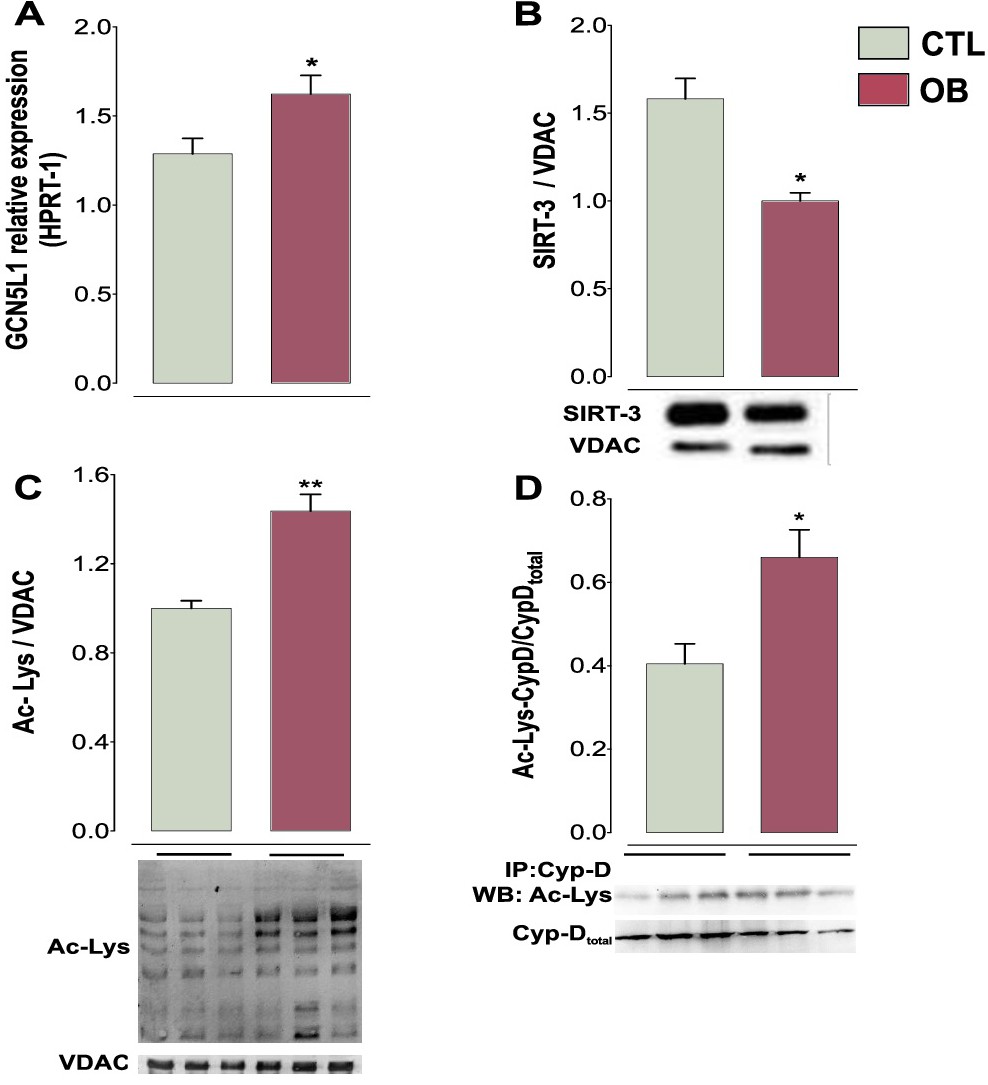
Fig. 4. SIRT3 down-regulation is associated with CypD acetylation in OB model. Hearts from rats with 12 months of obesity and MetS (OB) were isolated for a total gene expression of (A) GCN5L1. The gene expression levels were normalized to HPRT-1 gene expression and are presented as the relative expression. (B) Mitochondria were isolated from hearts of CTL or OB rats and analyzed for SIRT3 expression by western blot; VDAC expression was used as a reference. (C) Acetylation profile from cardiac mitochondria was analyzed by western blotting; VDAC was used as a reference. (D) Immunoprecipitation (IP) of protein extracts from heart mitochondria with monoclonal anti-CypD followed by immunoblot analysis with the anti-Ac-Lys antibody. Total CypD was used as control. The data are presented as mean ± SEM from at least 6 independent experiments for gene expression and 5 for protein levels. A t-test was performed to obtain the statistical analysis. Green bars indicate CTL groups and red bars OB groups. *p<0.035 and **p<0.006 vs CTL.